Code
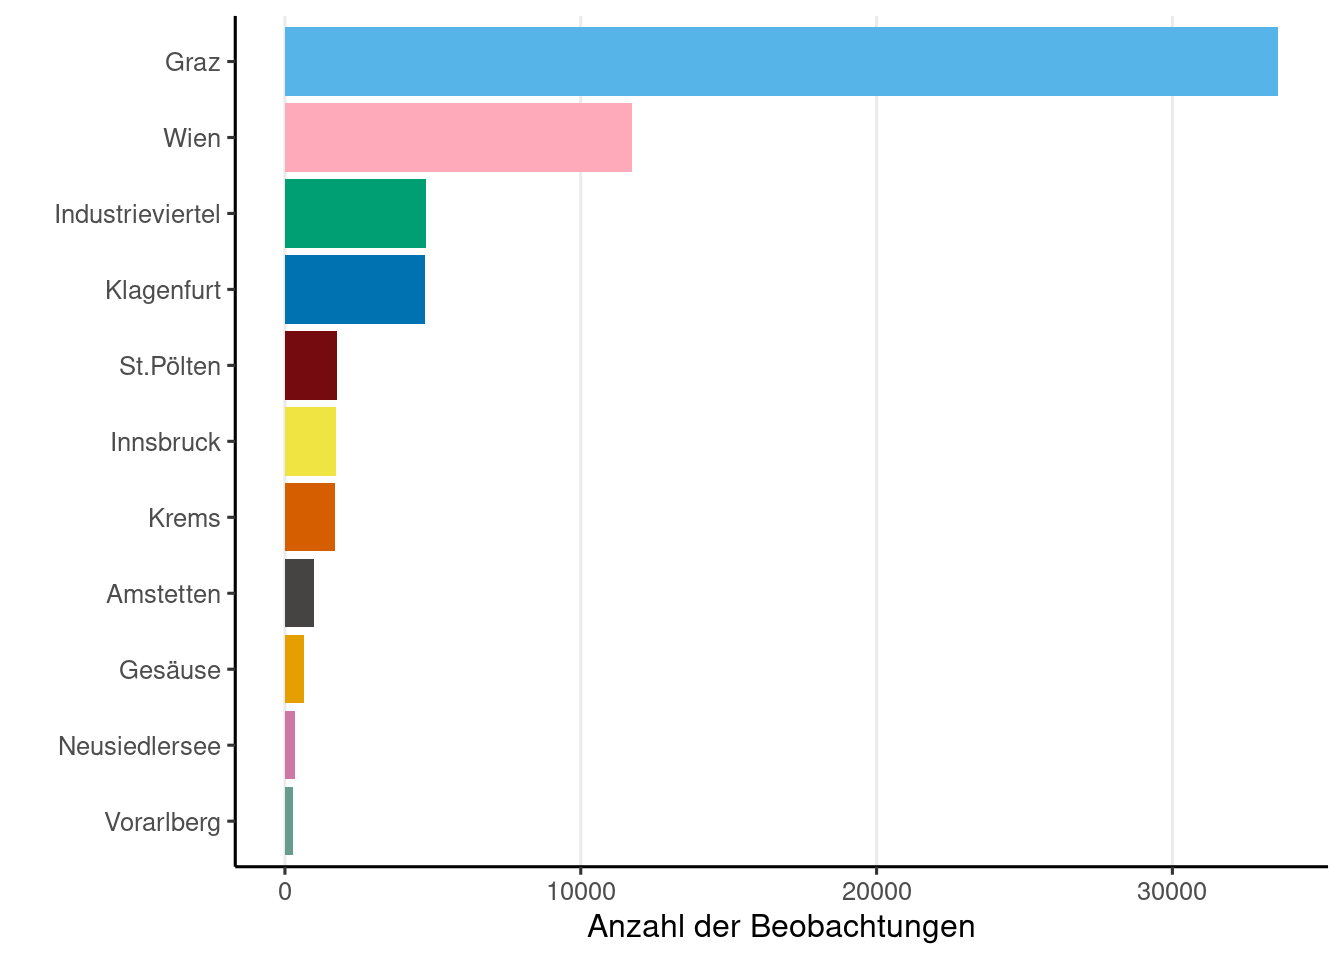
if (! is.null (obsResults)){|> group_by (project.name) |> summarise (n = n ()) |> ggplot (aes (x = reorder (project.name, n), y = n, fill = project.name)+ geom_bar (stat = "identity" , show.legend = FALSE ) + coord_flip () + labs (x = "" , y = "Anzahl der Beobachtungen" )+ theme (panel.grid.major.x = element_line ()else {print ('Noch keine Beobachtungen' )
Indizes zwischen den Regionen
Code
if (! is.null (obsResults)){|> group_by (project.name) |> summarise (nObserver = n_distinct (user.name),nObservations = n (),nTaxa = n_distinct (scientificName),nResearchGrade = sum (quality_grade == "research" ),|> select ("Region" = project.name, "BeobachterInnen" = nObserver, "Beobachtungen" = nObservations, "Taxa" = nTaxa, "Research Grade" = nResearchGrade) |> datatable (rownames = FALSE )else {print ('Noch keine Beobachtungen' )
Beobachtungen Regnum
Code
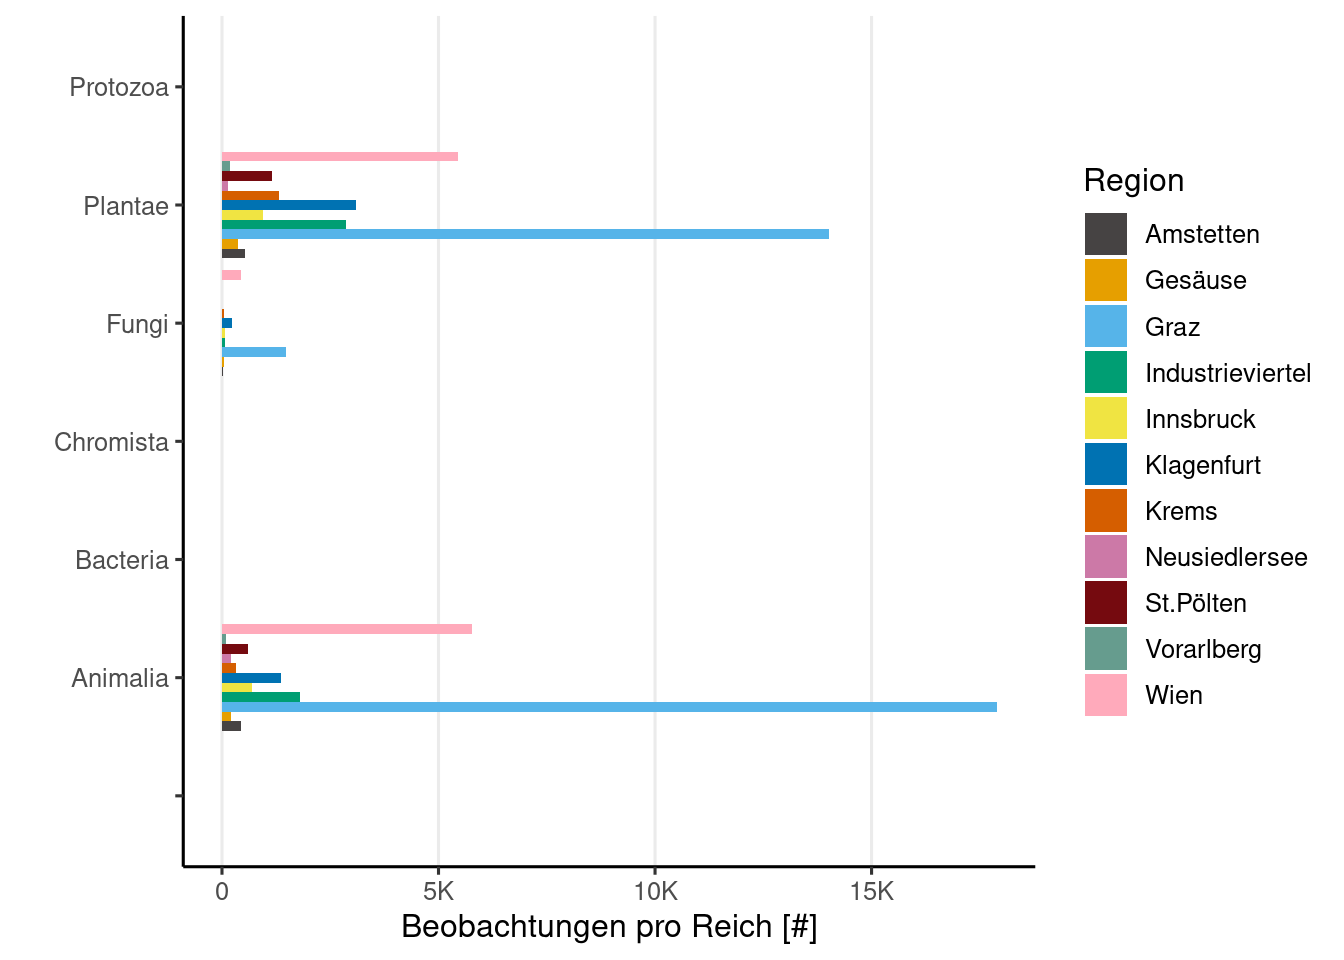
if (! is.null (obsResults)){|> drop_na (kingdom) |> count (kingdom, project.name) |> select (n, "Region" = project.name, kingdom) |> ggplot () + aes (x = kingdom, y = n, fill = Region) + geom_bar (position = 'dodge' , stat= 'identity' , show.legend = TRUE ) + labs (y = "Beobachtungen pro Reich [#]" ,x = "" + scale_y_continuous (labels = scales:: label_number (scale_cut = cut_short_scale ()),+ coord_flip (clip= "off" ) + theme (panel.grid.major.x = element_line ()else {print ('Noch keine Beobachtungen' )
Code
<- (lubridate:: now () + lubridate:: hours (12 )) |> :: with_tz (tzone = 'Europe/Vienna' )
Hinweis: Die Seite wird circa alle 12 Stunden mit neuen Daten befüllt. Nächstes Update um circa 2024-04-01 14:41:58.
Beobachtungskarte
Code
if (! is.null (obsResults)){<- obsResults |> drop_na (location, time_observed_at) |> separate (location, c ('latitude' , 'longitude' ), sep = ',' , remove = FALSE , convert = TRUE ) |> mutate (time_observed_at = lubridate:: ymd_hms (time_observed_at, tz = "Europe/Vienna" , quiet = TRUE ),label = glue ("{user.name} <br/> {scientificName} <br/> {time_observed_at} <br/> <a href='{uri}'>Beobachtung auf iNat</a>" ),group = lubridate:: wday (label = TRUE ,week_start = 1 ,locale= "de_AT" <- split (mapDf, mapDf$ group)<- leaflet () |> # create map with dataset setView (lng = 14.12456 , lat = 47.59397 , zoom = 6 ) |> # fyi geographic center of austria addTiles ()for (name in names (mapDfSplit)){if (nrow (mapDfSplit[[name]]) > 0 ){<- m |> addCircleMarkers (data = mapDfSplit[[name]],lng = ~ longitude,lat = ~ latitude,popup = ~ label,label = ~ scientificName,group = name,clusterOptions = markerClusterOptions ()|> addLayersControl (overlayGroups = names (mapDfSplit),options = layersControlOptions (collapsed = FALSE )else {print ('Noch keine Beobachtungen' )


